Wednesday, September 01, 2010

The Seamless Engine Goes Global

I've been doing more work on the terrain engine I described in my last post, which I'm now calling "seamless." It now works pretty well on a global scale.


There's still lots of work to do, especially on optimization at the OpenGL level, but I'm quite pleased, especially with how easy it is to get the height and image data out of osgEarth.

I encountered an interesting issue with the Quadrilateralized Spherical Cube that I was planning to use. I did find a good formal reference to the math behind the projection at this site. It turns out that the COBE satellite didn't use the QSC projection, but a slightly simpler one. Anyway, the seamless terrain algorithm requires a good estimate of the edge length of a patch on the grid and also a calculation of the minimum distance from the eye point to the edge. These are both difficult to calculate with the QSC projection, in part because the projection is not differentiable on the diagonals of the cube faces. I came up with another projection in which the grid lines are all great circles on the sphere:


I'm calling this projection an "Euler projection" by analogy to one class of Euler angles in which a rotation is measured with respect to fixed axes. For the equatorial cube faces, the vertical grid lines are the same as meridians of longitude, but the "latitude" is measured perpendicular to the horizontal axis, not in the longitudinal plane. The fact that the grid lines are now all segments of great circles makes the math almost trivially easy.

Now, we're not displaying a sphere (unlike some programs :) but an ellipsoid, so this measure will break down as we get close to the earth, but I'm prepared to hack that problem away.

The source to the seamless engine is available from this Git repository. Compilation requires osgEarth and Open Scene Graph from SVN and the whole thing is still a bit raw.

Sunday, August 15, 2010

a terrain engine for osgEarth

Lately I've been working on an experimental terrain engine for osgEarth on behalf of the folks at Pelican Mapping. osgEarth is a cool project that imports a variety of geographic raster and vector data into Open Scene Graph without requiring a lengthy pre-processing step. I've implemented the algorithm described in Seamless Patches for GPU-Based Terrain Rendering. The main feature of this technique is that LOD is determined at the patch edges, so that the polygons on either side of an edge always line up. The four triangles of a square patch may have different resolutions and are stitched together by a small number of strips. Here's a scene with Mt. Fuji:


And the wire frame view:


Of course, the objective is to get to a whole-earth scheme. I'm going with a projected cube approach, where the basic seamless algorithm is run on the six sides of the cube. I like the Quadrilateralized Spherical Cube which was developed for processing the data from the NASA Cobe satellite. A nice property of the projection is that is equal-area, so that a recursive devision in the cube face space should result in 4 equal-area spherical quads on the earth. It looks pretty:


Here's hoping that the calculation of the projection doesn't become a big bottleneck. Incidently, it was very hard to find the equations describing the projection: I eventually found a nice formulation here. But beware: there's a typo in Equation 3-38. "cos(theta)" should be "cos(phi)."

Wednesday, June 30, 2010

Cool Links

Here are some cool blogs I've come across recently. Virtual Globe and Terrain Rendering is devoted to a book-in-progress of the same name and has a nice collection of links to resources and other interesting blogs. RasterGrid has good articles on new features of OpenGL; I especially like Instance Culling Using Geometry Shaders, about doing culling on the GPU, and Uniform Buffers vs Texture Buffers. For an old graphics fossil like me, these are great topics in modern 3D graphics programming. Also, the Outerra engine guys are doing cool stuff and writing about it too. I've added these to my blog list, and so should you!

Wednesday, June 16, 2010

Everything You Always Wanted to Know About StateSets (But Were Afraid to Ask)

Here's part 2 of my articles on Open Scene Graph graphics state management. Part 1 covered the StateSet class, which OSG programmers should be familiar with. This part looks behind the scenes at how the OSG "backend" optimizes rendering for minimizing graphics state changes. Enjoy!

Thursday, May 13, 2010

Paper Models in Blender

I just discovered this e-book on using free software, like Blender and Inkscape, to design paper models. Actually, these models are usually made of thicker card stock than paper. Anyway, this is about as far from real-time simulation as you can get, but the e-book is still a lot of fun.

Friday, April 16, 2010

I've written the first part of a series on Open Scene Graph graphics state optimization here. This goes into some detail about graphics modes, attributes, the StateSet object, and the low level State object. Check it out.

Tuesday, March 23, 2010

Floating Point Depthbuffers in OSG

I submitted a new demo to the Open Scene Graph project that shows how to set up a floating point depth buffer. The standard way to do this is to create a Frame Buffer Object and attach a depth texture with a floating point format. That won't work if you're doing multisampling antialiasing; it that case, you attach a "render buffer" that has the appropriate number of samples to the FBO. Open Scene Graph takes care of many of the details for you.

The demo shows how to set up an FBO with a floating point depth buffer, as well as the effects of "inverting" the depth test. Setting 1.0 to correspond to the near plane and 0.0 to the far plane turns out to have better behavior than the more usual way. Also, the demo allows the user to cycle between all the available multisampling modes, as well as between floating point and integer depth buffers, of course. If you can't wait for this to show up in the OSG source tree, get the patch yourself.

Monday, March 01, 2010

Vertex Cache Optimization for OSG

I implemented Tom Forsyth's Vertex Cache Optimization algorithm in Open Scene Graph (OSG). The quick summary is that indexed lists of triangles in a mesh are more efficient than traditional representations like triangle strips. GPUs keep a cache of the post-transform values for the most recently used vertices in a mesh. This can avoid a whole lot of work, such as rerunning vertex shaders. Tristrips don't make good use of this cache because they introduce a new vertex for every triangle and only reuse the last two vertices. On the other hand, a random mesh order isn't good either; the triangles in a mesh need to be in a good order to take proper advantage of the cache. Tom describes an efficient algorithm for optimizing a mesh for the vertex cache. It produces an order that is "oblivious" to the actual cache size i.e., it will work well on a range of hardware.


The algorithm does work as advertised. I tried it on the Happy Buddha model, which is a monster-size mesh with over a million triangles. On my machine the optimization reduces the draw time for this mesh by 38 percent, which is enormous. This is a special case because the mesh is so large and regular, and Your Milage May Vary, but it does seem like a worthwhile optimization for large meshes. I've submitted my code to the OSG project.

Tuesday, February 23, 2010

more VirtualPlanetBuilder fun

Let's add some other imagery to our Mt. Washington terrain. The digital orthophoto quadrangles published by the USGS are a decent source of free aerial photographs of the U.S. These images are rectified, which means that any effects from the tilt of the camera and relief of the terrain have been removed; just the thing for draping over a DEM. Unfortunately they are in black-and-white, but the resolution is 1 meter, which isn't bad. The image files are georeferenced, very convenient for building a mosaic with VirtualPlanetBuilder because we don't need to specify any additional projection or position parameters with each image. Generally one topographic map quad is divided into 4 DOQs. This makes for a marathon download session at the USGS website; maybe someone knows a better way?

It's straightforward to build a new database using an osgdem command similar to that used to build the map overlay database. One complication is that we now have 24 image files to deal with, instead of 5, and I don't feel like typing all the names on the command line. The downloaded files from the USGS have the form O4407145.NES.837049.tgz, and their only contents seems to be another tar file. Extracting that, we get the TIFF file and a header file. I arranged these all in directories; for example, the path to one TIFF file is O4407145.NES/O4407145.NES.837049.tif. We generate the command line with a little Unix magic:

ls O*.*/*.tif | sed -e's;.*;-t &;' \
| xargs osgdem --TERRAIN --geocentric -d elev-meters.tif \
-l 8 -o wash-photo.ive


We have a nice image when we look at the scene with osgviewer, although the gray imagery would benefit from colors and more contrast. But what would be very cool is display the topographic map tiles and the orthophotos on the same scene and transition between the two. VirtualPlanetBuilder lets you specify that images belong to different layers, and the OSG example program osgmultitexturecontrol supports transitioning between layers based on elevation above terrain. In order to build the new database, we need to specify a "--layer 1" argument before each orthophoto:

ls O*.*/*.tif | sed -e's;.*;--layer 1 -t &;' |\
xargs osgdem --TERRAIN --geocentric -d elev-meters.tif \
-t carter-dome-trim.tif -t crawford-trim.tif -t jackson-trim.tif\
-t stairs-trim.tif -t k44071c3/k44071c3-trim.tif \
-l 8 -o wash-layer.ive

Phew! Unfortunately, we don't see the map layer at all with the osgmultitexturecontrol program from the OSG distribution. A look at the code reveals the problem: the elevation at which the transition occurs is hard-wired at 1000 kilometers. That's fine for viewing a whole-earth database from space, but doesn't do us any good. I hacked in an elevation transition argument, and got some better results. We start with the map view:

and as we zoom in, we transition from this:

to this:

Pretty cool. It would be nice to spruce the photos up a bit, perhaps by using the approach of merging color from lower resolution LANDSAT imagery with these high resolution DOQs.

Tuesday, February 02, 2010

Fun with VirtualPlanetBuilder

I've been playing with the VirtualPlanetBuilder tool for Open Scene Graph (OSG). This flexible program builds paged terrain databases with automatic level of detail that can be loaded into the standard osgviewer program or any other program that uses the standard OSG loaders. It takes heightfield data and imagery as input, and it accepts a variety of formats because it uses the GDAL geospatial data library. If the input data is georeferenced, the excercise of building a terrain database is almost too easy.

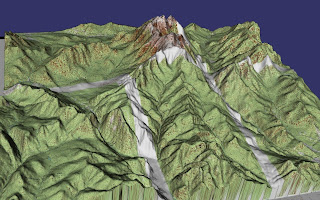
While VirtualPlanetBuilder can be used to build terrabyte-sized whole-earth databases, my own ambitions are so far more modest: build a small patch of terrain, drape some terrain over it, and fly around. Inspired by the 
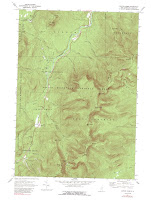
vinyl relief maps that my parents mounted on the wall of our apartment when I was growing up, I decided that it would be fun to drape topographic maps over the terrain. I made a little geocentric database of the Mt. Washington area. I found this useful set of links to sources of digital elevation data.

For the DEM data, I went with webGIS, which provides DEMs based on USGS quadrangles. This turned out to not be terribly convenient, as there's state and county map interface but nothing that graphically shows the layout of the quadrangles. I flipped back-and-forth to the USGS web site and, armed with my knowledge of the White Mountains, downloaded the DEM data for the Mount Washington, Carter Dome, Crawford Notch, Stairs Mountain, Jackson, and Mount Dartmouth quadrangles. There's probably a more automated way to do this.

I downloaded the images of the map quadrangles using the usgsquads.com Goggle Earth interface, but this was a bit broken too. The map that contains Mt. Washington itself is 7.5 x 15 minutes, and the download link to it was broken. I went to the USGS EarthExplorer to grab that map. I would have been better off getting all the map images there. The maps at usgsquads.com seem to be pretty old and their elevations are in feet, whereas the map from USGS was in meters. Oh well, it still looks nice.

Because the .dem height data files and the TIFF map files are geolocated, it is quite straight forward, after a little preparation, to feed them to VirtualPlanetBuilder's osgdem program and get a data base. But my first effort had a problem; the maps have borders, and they show up on the terrain!

Whoops. Because the map images are projected in UTM, the latitude and longitude boundaries of the maps are not horizontal and vertical in the image, so it would be awkward to trim the maps in a program like the Gimp.

Fortunately osgdem needs its data in a geographic coordinate system and reprojects if necessary, so we can do the reprojection ourselves and trim the borders using a GDALutility.

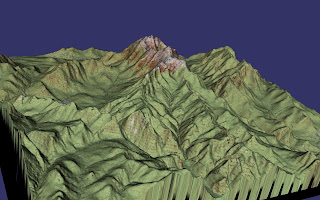
That looks better, but the relief of the mountains seems exaggerated, just like those vinyl relief maps. A little snooping with gdalinfo shows that the elevation data is in feet, but osgdem builds a geocentric database using meters, and that info got lost somewhere along the way. Fortunately it's easy to fix this up with a GDAL tool.

Here's the complete recipe. First, many of the .dem files have the same name, so I renamed them in the directories where I unpacked them:

for i in *.zip; do
mkdir ${i%.zip}
mv $i ${i%.zip}
done


Then I combined them into one TIFF and built overviews:

gdalwarp 16*/*dem elev.tif
gdaladdo -r average elev.tif 2 4 8 16 32

The overviews are probably not necessary for such a tiny database, but it's recommended anyway. We have to fix the feet / meters problem:

gdal_translate -scale 0 1.0 0 0.3048 elev.tif elev-meters.tif


Next, fix up the map borders. The maps are encoded using index color, which doesn't doesn't work well with fancy interpolation methods, so expand them into RGB:

for i in carter-dome.tif jackson.tif stairs.tif k44071c3/k44071c3.tif ; do
gdal_translate -expand rgb $i ${i%.tif}-rgb.tif
done

and then use gdalwarp to reproject and trim. For example:

gdalwarp -t_srs "WGS84" -te -71.25 44.25 -71.125 44.375 \
-r cubicspline carter-dome.tif carter-dome-trim.tif

Build overviews:

for i in carter-dome-trim.tif crawford-trim.tif jackson-trim.tif \
stairs-trim.tif k44071c3/k44071c3-trim.tif ;do
gdaladdo -r average $i 2 4 8 16 32;
done

Finally, run osgdem:

osgdem --TERRAIN --geocentric -d elev-meters.tif -t carter-dome-trim.tif \
-t crawford-trim.tif -t jackson-trim.tif -t stairs-trim.tif \
-t k44071c3/k44071c3-trim.tif -l 8 -o wash.ive

and have fun!